The ADX Indicator: Unveiling the Secret Sauce of Market Trends
Have you ever wondered how traders spot strong trends in the stock or forex market? Or perhaps you’ve thought, “Is there a magic formula that tells me when to hop in or out of a trend?” Welcome to the world of the ADX indicator—an essential tool for anyone who wants to decode the secret signals of financial markets. Imagine having a reliable compass when crossing the vast ocean of trading; that’s precisely what the ADX does for traders. Let’s dive in together and demystify the ADX indicator, leaving no stone unturned!
Introduction to the ADX Indicator
Navigating the financial markets without any guidance is like sailing blindly in a storm. The ADX indicator acts as a beacon, helping traders figure out if the market is trending—and just how powerful that trend might be.
Discover what is ADX indicator, its role in algorithmic trading, and find out how the ADX indicator works. Plus, learn about algorithmic trading software price.
What is the ADX Indicator?
The Average Directional Index (ADX) indicator is a technical analysis tool designed to measure the strength (not the direction) of a market trend. It doesn’t tell you if the price will go up or down—just how strong the trend currently is. Imagine it as the wind meter on a sailor’s boat: it doesn’t tell the direction but tells you how hard the wind is blowing.
- Keypoint: The ADX helps traders decide whether to follow a trend or stay out during uncertain times.
History and Development
The ADX was introduced by J. Welles Wilder Jr. in his 1978 book, New Concepts in Technical Trading Systems. Since then, it’s become a staple in the toolbox of both manual and algorithmic traders. Wilder’s innovation aimed to address one huge trader’s pain: knowing not just if a trend exists, but if it has the oomph worth riding!
How Does the ADX Indicator Work?
The ADX itself is actually part of a larger family:
- DI+ (Positive Directional Indicator)
- DI- (Negative Directional Indicator)
- ADX (Average Directional Index itself)
A bit like a trio of musicians, each plays a role but together, they create harmony that traders listen to for signals.
The ADX is calculated using the difference between DI+ and DI-, then smoothed over several periods (usually 14 days in default settings). The resulting value shows trend strength:
- Above 25: Strong trend (up or down)
- Below 20: Weak or non-existent trend
Analogy: Just as a gym-goer checks the weight they’re lifting (not just how fast they lift it), traders check the strength of trends with the ADX—not just direction.
Key Components of the ADX
Let’s break these down in plain English:
- DI+: Measures upward price movement.
- DI-: Measures downward price movement.
- ADX: Smooths out the differences and tells you, overall, “Hey, there’s a powerful trend here!” (or not).
Typically, all three lines (DI+, DI-, and ADX) appear on a single trading chart for clarity.
Understanding ADX Values and Signals
ADX values range from 0 to 100, giving traders a quick sense of trend power:
- 0–20: Market is aimless, no clear trend.
- 20–40: Trending, the trend gets stronger as numbers rise.
- 40–60: Very strong trend—think “full steam ahead.”
- 60–100: Exceptionally strong trend, although rarely seen.
It’s important to remember:
ADX does not tell you if the trend is up or down—just if it’s strong!
Interpreting ADX: Strong vs. Weak Trends
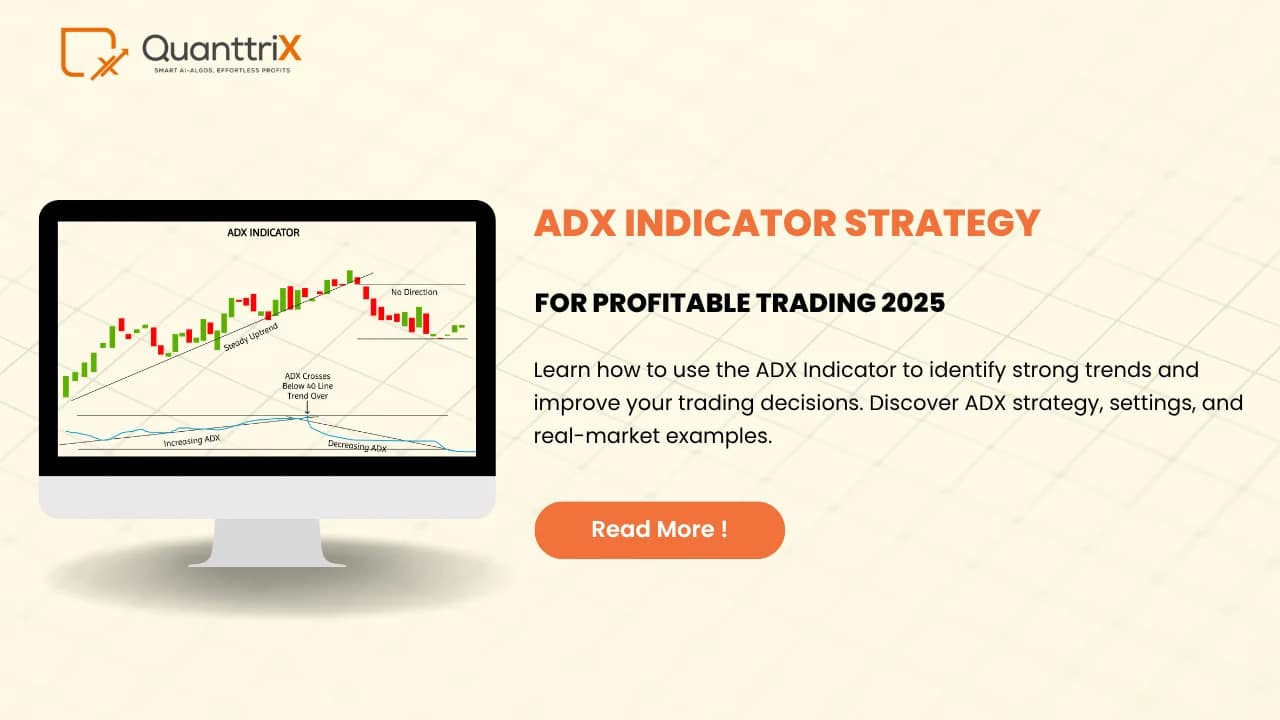
- When ADX is Rising: Trend—either up or down—is getting stronger.
- When ADX is Falling: Trend is losing steam, and the market may be entering a sideways pattern.
Traders often look for crossovers with DI+ and DI- for buy/sell decisions, but ADX is more about the “muscle” behind the trend.
ADX Indicator in Day Trading
Day traders can rely on ADX to:
- Stay in strong trends and avoid “choppy” markets with no direction.
- Set trailing stop-loss levels, managing their risk with more confidence.
- Avoid “false breakouts,” where price movements fizzle out quickly.
Analogy: It’s like using a weather app to avoid stormy seas—only trading when the wind (trend) is strong and steady.
ADX in Algorithmic Trading
Algorithmic trading leverages programmed strategies to buy and sell at lightning speeds. The ADX indicator can be programmed into these strategies to:
- Automatically filter for strong trends
- Avoid entering trades when the market becomes too quiet or unpredictable
- Combine with other indicators to create robust trading rules
For example, an algorithm might buy only when ADX is above 25 (market trending) and DI+ crosses above DI- (trend is upward).
Algorithmic Trading Software Price
One of the most common questions is:
How much does algorithmic trading software with ADX cost?
- Entry-Level Software: $0–100/month—Basic platforms, often for beginners.
- Professional Suites: $100–1,000/month—Offer extensive automation, indicator support (including ADX), advanced charting.
- Custom/Institutional Solutions: $1,000+/month—Tailored for high-frequency or hedge fund traders, packed with analytics and support.
Keypoint: Prices vary widely based on features, data access, and support levels. Always check whether the software includes customizable indicators like ADX before buying.
ADX vs. Other Technical Indicators
Here’s how ADX stacks up:
| Indicator | Measures Trend Strength | Measures Direction | Common Use |
| ADX | Yes | No | Trend Confirmation |
| RSI | No | Yes | Overbought/Oversold Signals |
| MACD | Yes | Yes | Trend & Momentum |
| Moving Average | No | Yes | Smoothing Price Data |
The ADX shines brightest when you need to know if the trend you’re about to follow is truly powerful—or just a passing breeze.
Advantages of Using the ADX Indicator
- Identifies market conditions: Know if the market is trending or flat.
- Works on all time frames: Daily to 1-minute charts.
- Objective measurement: Takes the guesswork out of trend strength.
- Enhances confidence: Strengthens other strategies by confirming when to trade.
Limitations and Cautions
No tool is perfect:
- No Direction Information: You’ll need other indicators (or price action) to know which way a trend goes.
- Lagging Nature: Like most indicators, ADX relies on past data (lagging indicator).
- False Signals: Sudden market spikes can temporarily inflate ADX, so don’t use it in isolation.
- Not for Sideways Markets: It may offer little value when the market lacks trends.
Tips for Effective Use of ADX
Here are some simple steps and cautions for getting the most from the ADX indicator:
- Combine Indicators: Use ADX with other tools (like moving averages or MACD) for better results.
- Avoid Overtrading: Don’t force trades when ADX shows weak trends.
- Use Default Settings First: Most platforms use 14 periods—start there before experimenting.
- Watch for DI Crosses: Many traders use DI+ crossing above DI- as a buy hint, and vice versa.
- Stay Alert: Remember, news events can quickly change market conditions—even the ADX can’t predict the future!
Conclusion
The ADX indicator is like a trend detective—quietly analyzing the market’s strength without bias or emotion. For both new and seasoned traders, it’s a fundamental tool for making smarter, more informed decisions. Combine it wisely with other strategies, and you’ll find yourself sailing through the markets with greater clarity and confidence.
FAQs About the ADX Indicator
Q1. What is the ADX indicator and what does it measure?
The ADX indicator, or Average Directional Index, measures the strength of a trend in the market—it does not specify direction.
Q2. How can I use ADX for intraday trading?
Use ADX to identify when the trend is strong (typically above 25) before placing trades. Avoid trading when ADX is low, as markets are often range-bound.
Q3. Is the ADX indicator suitable for beginners?
Yes! Its values are simple to read, and it works on all time frames. Beginners should, however, combine it with other indicators for best results.
Q4. Does algorithmic trading software come with ADX indicators?
Most algorithmic trading platforms include the ADX indicator as part of their standard toolsets. Be sure to check features and compare algorithmic trading software price before subscribing.
Q5. Can the ADX indicator guarantee profitable trades?
No trading tool can guarantee profits. The ADX should be part of a broader strategy, used alongside risk management, and combined with other analytical tools.
